Fuse Dots into Bars, Create a Stacked Bar Chart, and Use a Formula to Determine Bar Length
With a categorical or binned numeric attribute on an axis, CODAP plots cases as points stacked in each category or bin. You can also click on the Configuration icon in the inspector palette to the right of the graph and then select Fuse Dots into Bars.

The bar lengths are proportional to the number of cases in each category.
If you mouse over a bar, a tooltip will appear indicating the number and percentage of cases belong to each bar, as illustrated below.

After fusing dots into bars, it is possible to drag an attribute to the middle of the graph to color the bars by that attribute, making a stacked bar chart as shown in the example below.

After fusing dots into bars, it is also possible to change the Y axis to represent the percentage of cases in each category. To do this, click on the Configuration icon again and set the scale to "Percent."

Sometimes it's useful to compute the bar lengths with a formula. To do so, click on the Configuration icon again and set the scale to Formula.
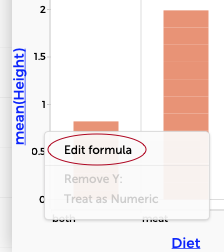
The bar lengths are now determined by the value of the formula computed for the cases belonging to each category. The formula appears as the label for the numeric axis. In the example shown here, the Y axis is showing the mean height for each of the three diet categories.
To edit the formula, click where it appears on the numeric axis and choose Edit Formula.
Note that it is also possible to plot numeric values as bars, as described here.
You can also fuse dots into bars to create a histogram for a numeric distribution in CODAP.